Sales Analytics
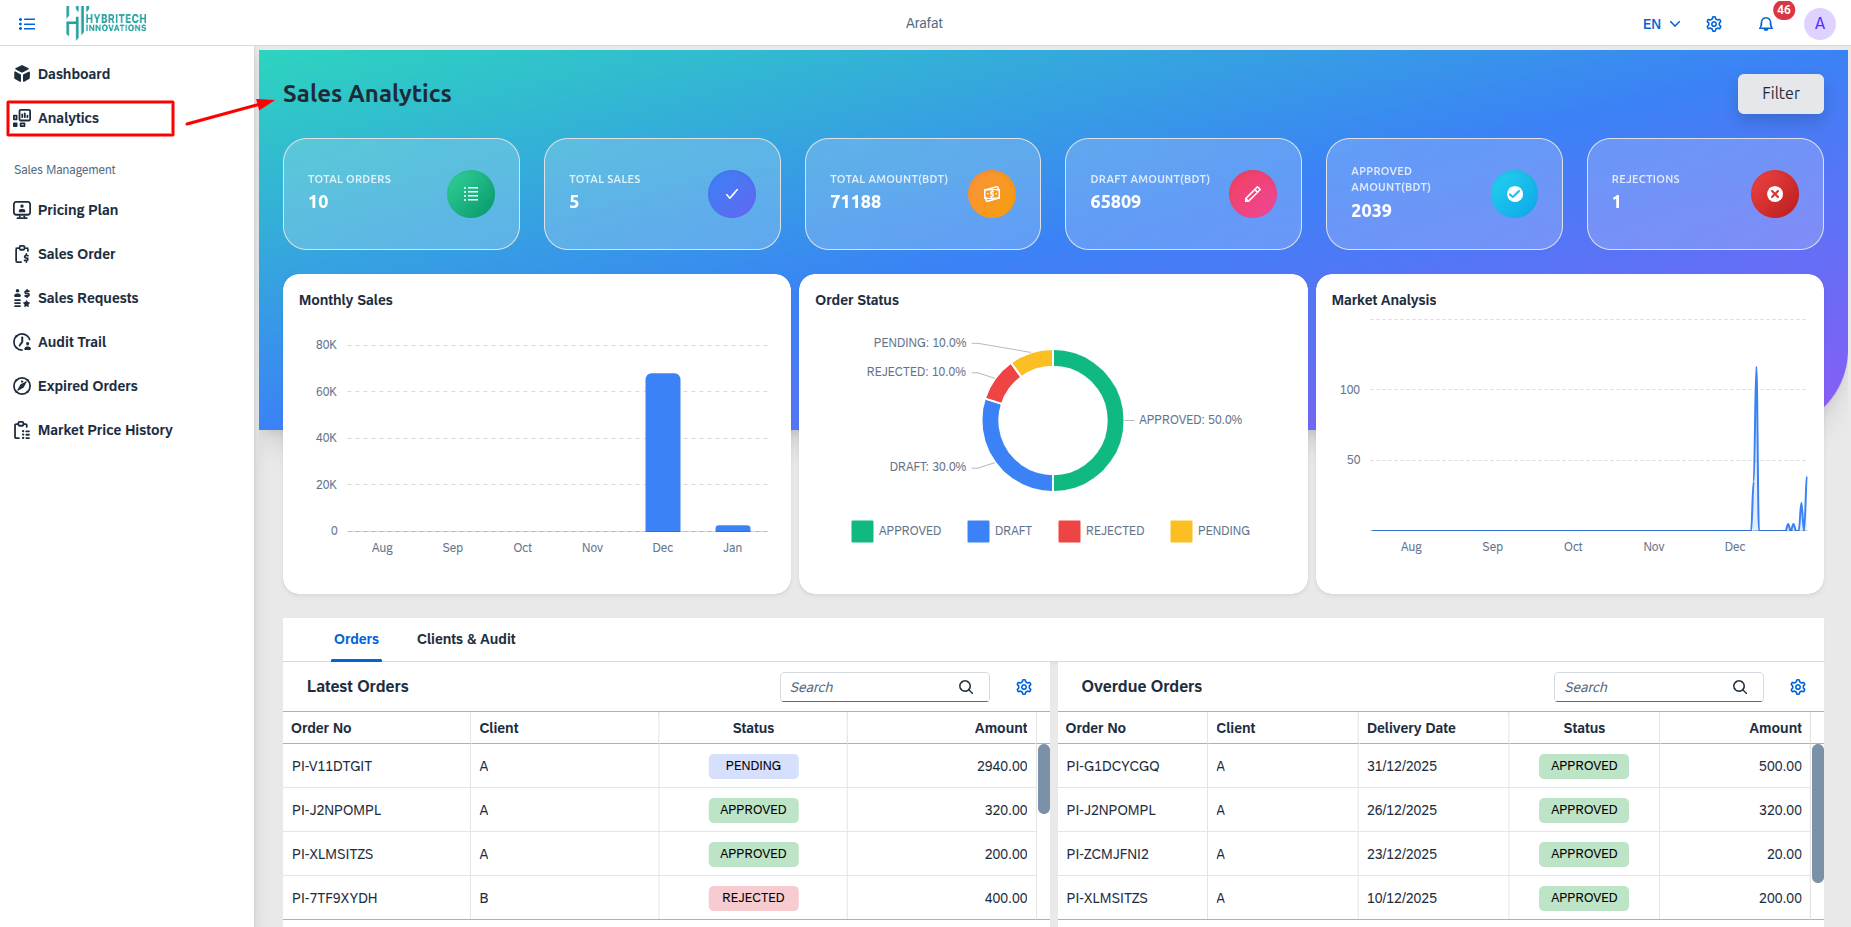
The Sales Analytics screen provides a centralized and comprehensive overview of sales performance within the system. It is designed to present key business metrics, visual summaries, and actionable insights that support monitoring, analysis, and decision-making for sales operations.
Analytics Summary Cards
At the top of the Analytics screen, summary cards display high-level sales indicators: By default, the Analytics screen displays data for the most recent six (6) months. Users can modify this period using the filter button to view analytics metrics, charts, and reports for a specific month range as required.
-
Total Orders: Calculated as the total number of sales orders created within the selected date range, regardless of order status.
-
Total Sales: Derived from the number of sales orders that have been approved and completed within the selected period.
-
Total Amount: Computed as the sum of the monetary values of all sales orders within the selected date range.
-
Draft Amount: Calculated as the sum of the values of sales orders that are currently in Draft status within the selected period.
-
Approved Amount: Calculated as the sum of the values of sales orders that are in Approved status within the selected period.
-
Rejections: Counted as the total number of sales orders marked as Rejected within the selected date range.
Visual Analytics
Three main charts provide visual representation of the data:
1. Monthly Sales
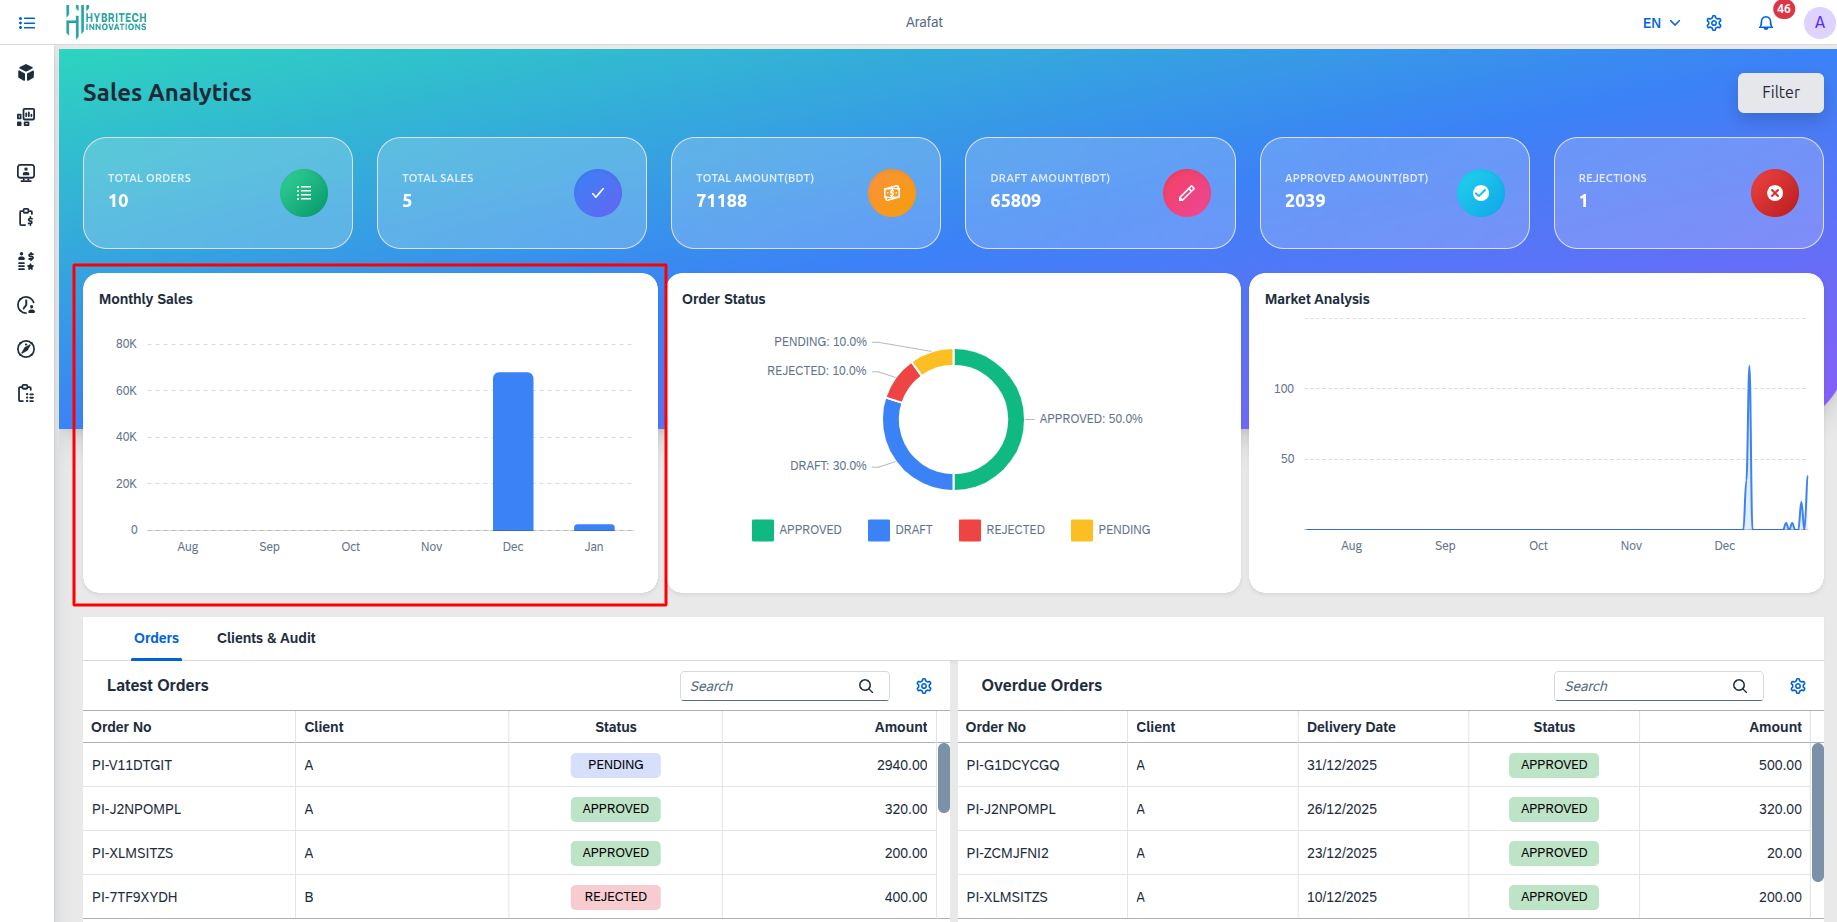
The Monthly Sales bar chart defaults to the past 6 months, showing sales per month (X-axis: months; Y-axis: BDT amount). It updates via the Filter for custom ranges.
2. Order Status

A donut chart providing a percentage breakdown of orders by their status:
- Approved: Orders successfully processed.
- Draft: Orders pending finalization.
- Rejected: Orders that were cancelled or did not meet criteria. This chart displays the percentage ratio of all sales orders by their current status within the selected date range. It provides a clear view of the order status distribution and automatically updates when the date range is changed using the Filter button.
3. Market Analysis
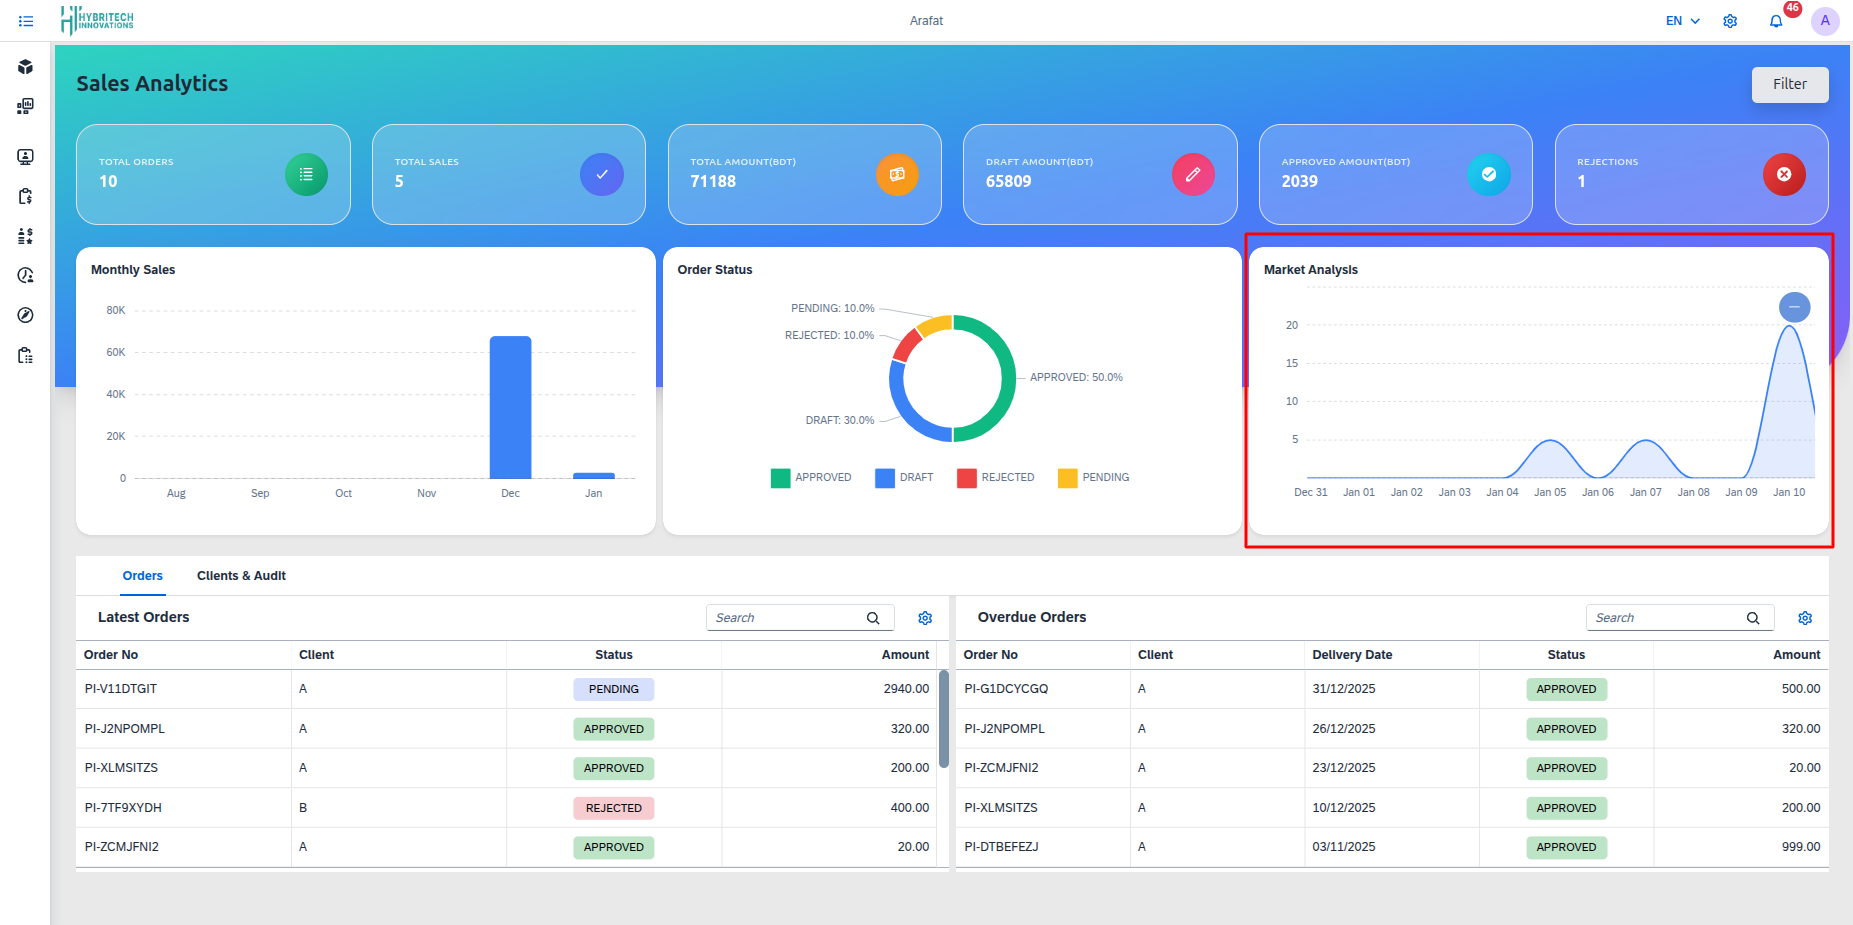
The Market Price History line chart displays commodity price fluctuations over time. The X-axis represents the timeline (days or months), and the Y-axis shows the price in BDT, with the line illustrating the market’s peaks and troughs to support informed procurement and sales decisions.
Orders Tab
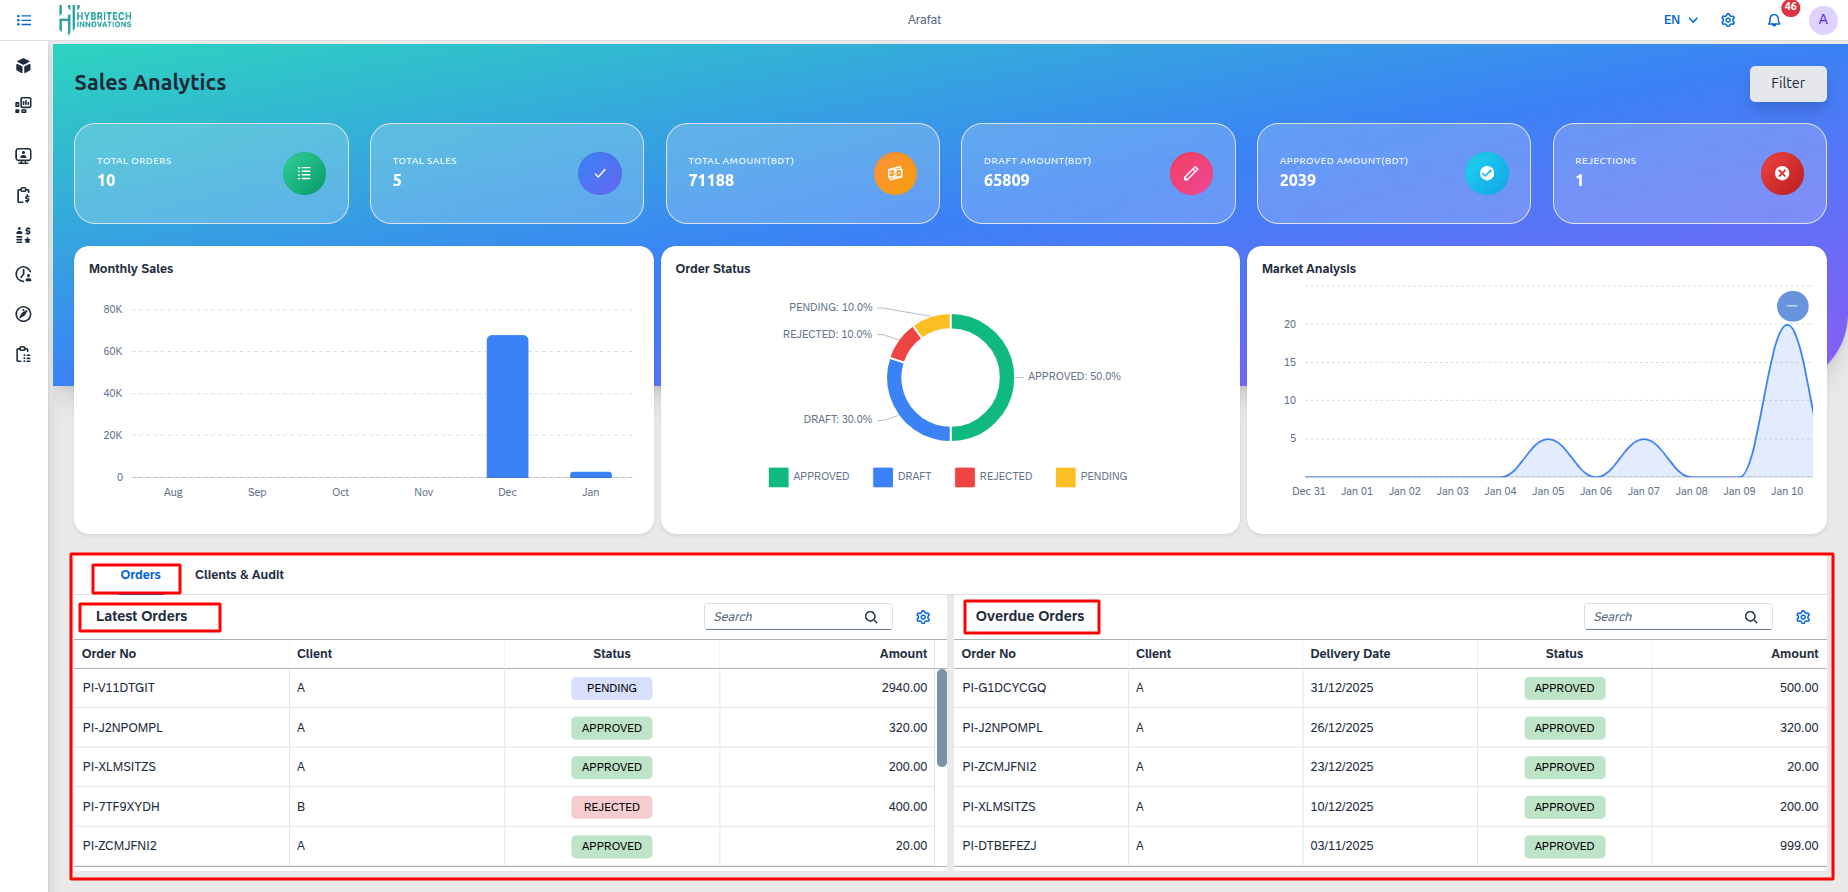
Contains lists of orders categorized by their timeliness:
-
Latest Orders: Track recent transactions, status (Draft/Approved), and total amounts.
- Columns: Order No, Client, Status (e.g., Approved, Draft), Amount.
-
Overdue Orders: Identify orders that have missed their scheduled delivery dates for immediate action.
- Columns: Order No, Client, Delivery Date, Status, Amount.
Clients & Audit Tab
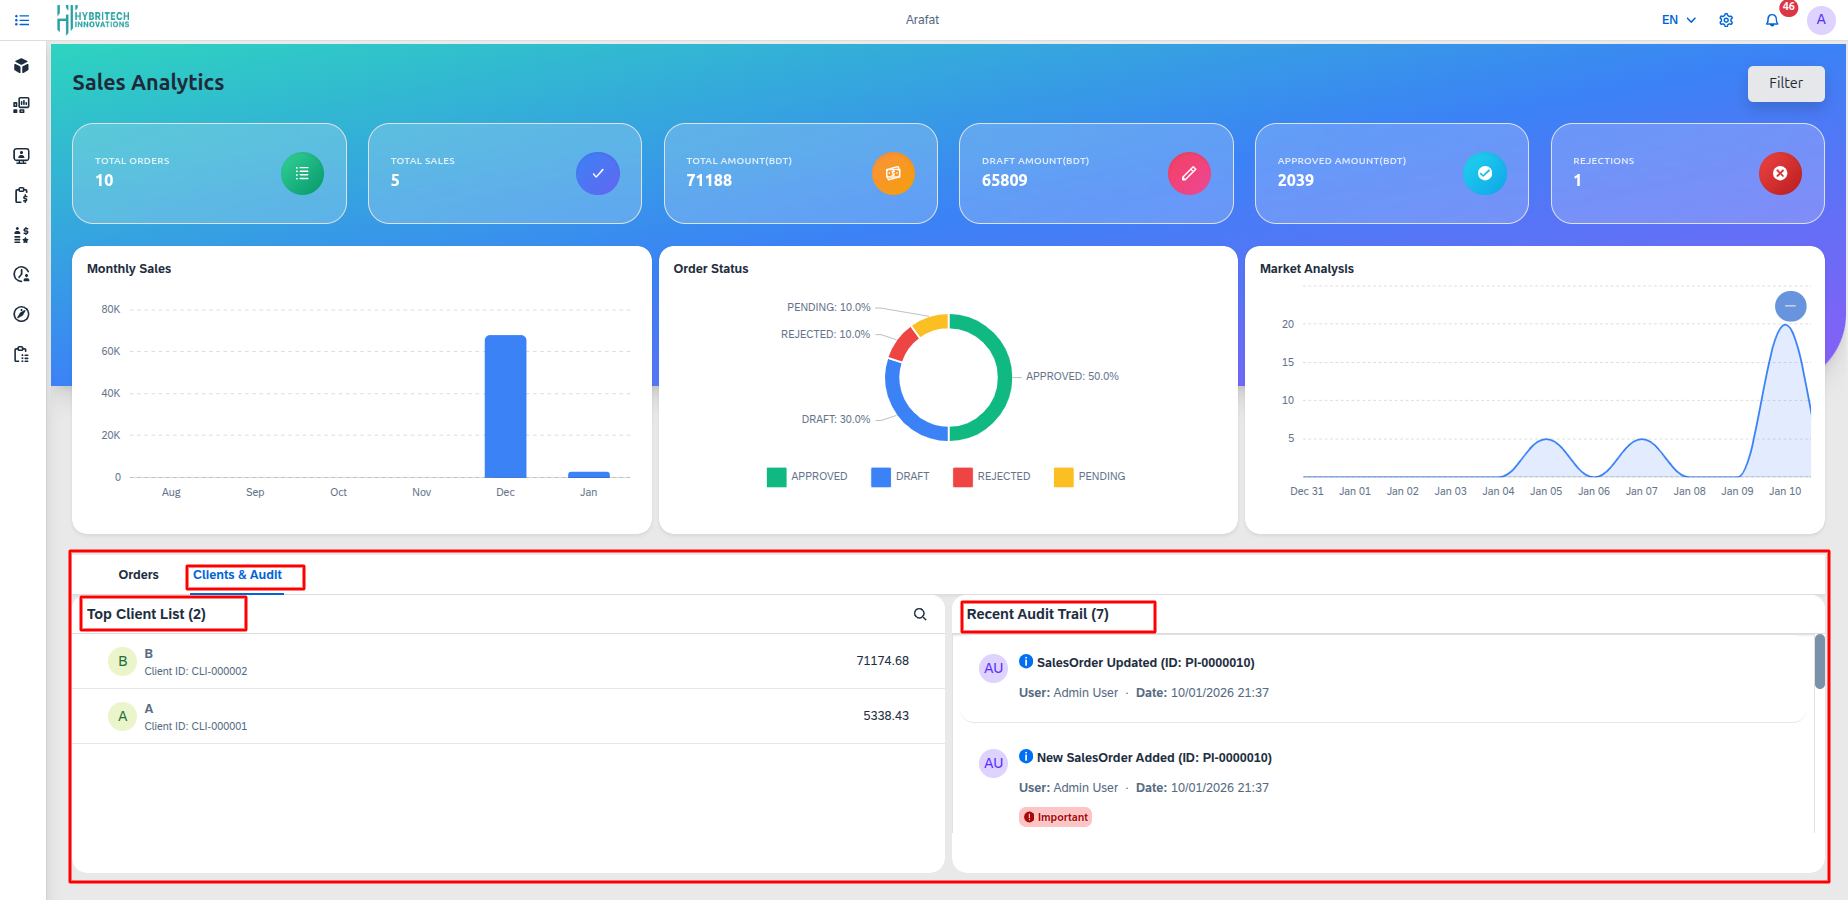
Focuses on customer data and system activities:
- Top Client List: Rankings of clients based on their total purchase volume/contribution.
- Recent Audit Trail: A chronological log of system actions associated with sales.
- Details: Action taken (e.g., SalesOrder Updated), User responsible, and Timestamp.
Interactive Features
- Filter: A button located at the top right allows users to refine the data displayed based on specific criteria.
- Search: Each list/table includes a search bar for quickly finding specific orders or clients.
- View Customization: Tables offer settings to adjust column visibility and row density.